2020年核电运行数据表明,在2019冠状病毒病大流行期间,世界各地的核电营运者维持了可靠的核电厂运行。原子能机构今日发布了2020年核电状况年度数据,这些数据是通过原子能机构公开的综合性核动力数据库动力堆信息系统收集的。在2019冠状病毒病大流行期间,利用现有核电装机容量提供了可靠的低排放电力。
在2019冠状病毒病期间,核电证明了其作为适应性强、可靠性高的供电来源的关键作用
2020年核电运行数据表明,在2019冠状病毒病大流行期间,世界各地的核电营运者维持了可靠的核电厂运行,并利用现有核电装机容量提供了可靠的低排放电力。

在2020年,2019冠状病毒病的暴发使经济和社会活动受到限制,导致许多国家的电力需求出现前所未有的持续下降,相对于2019年的水平,下降幅度达到10%或以上。这给电力生产商和系统营运者都带来了挑战。随着可再生电力的贡献越来越大,低碳电力得到了普遍支持,核电生产已证明有韧性、可靠性高而且适应性强。核电的灵活性展示了其如何能为清洁能源转型提供支持。
法国电力公司核能和热能部门副总裁兼集团高级执行官Cedric Lewandowski指出,在封禁期间,法国的电力消费下降约15%,大部分需求通过核能、水电和其他可再生能源予以满足。核电厂的灵活性得到了广泛利用,与2019年同期相比,负荷变化数量上升50%。

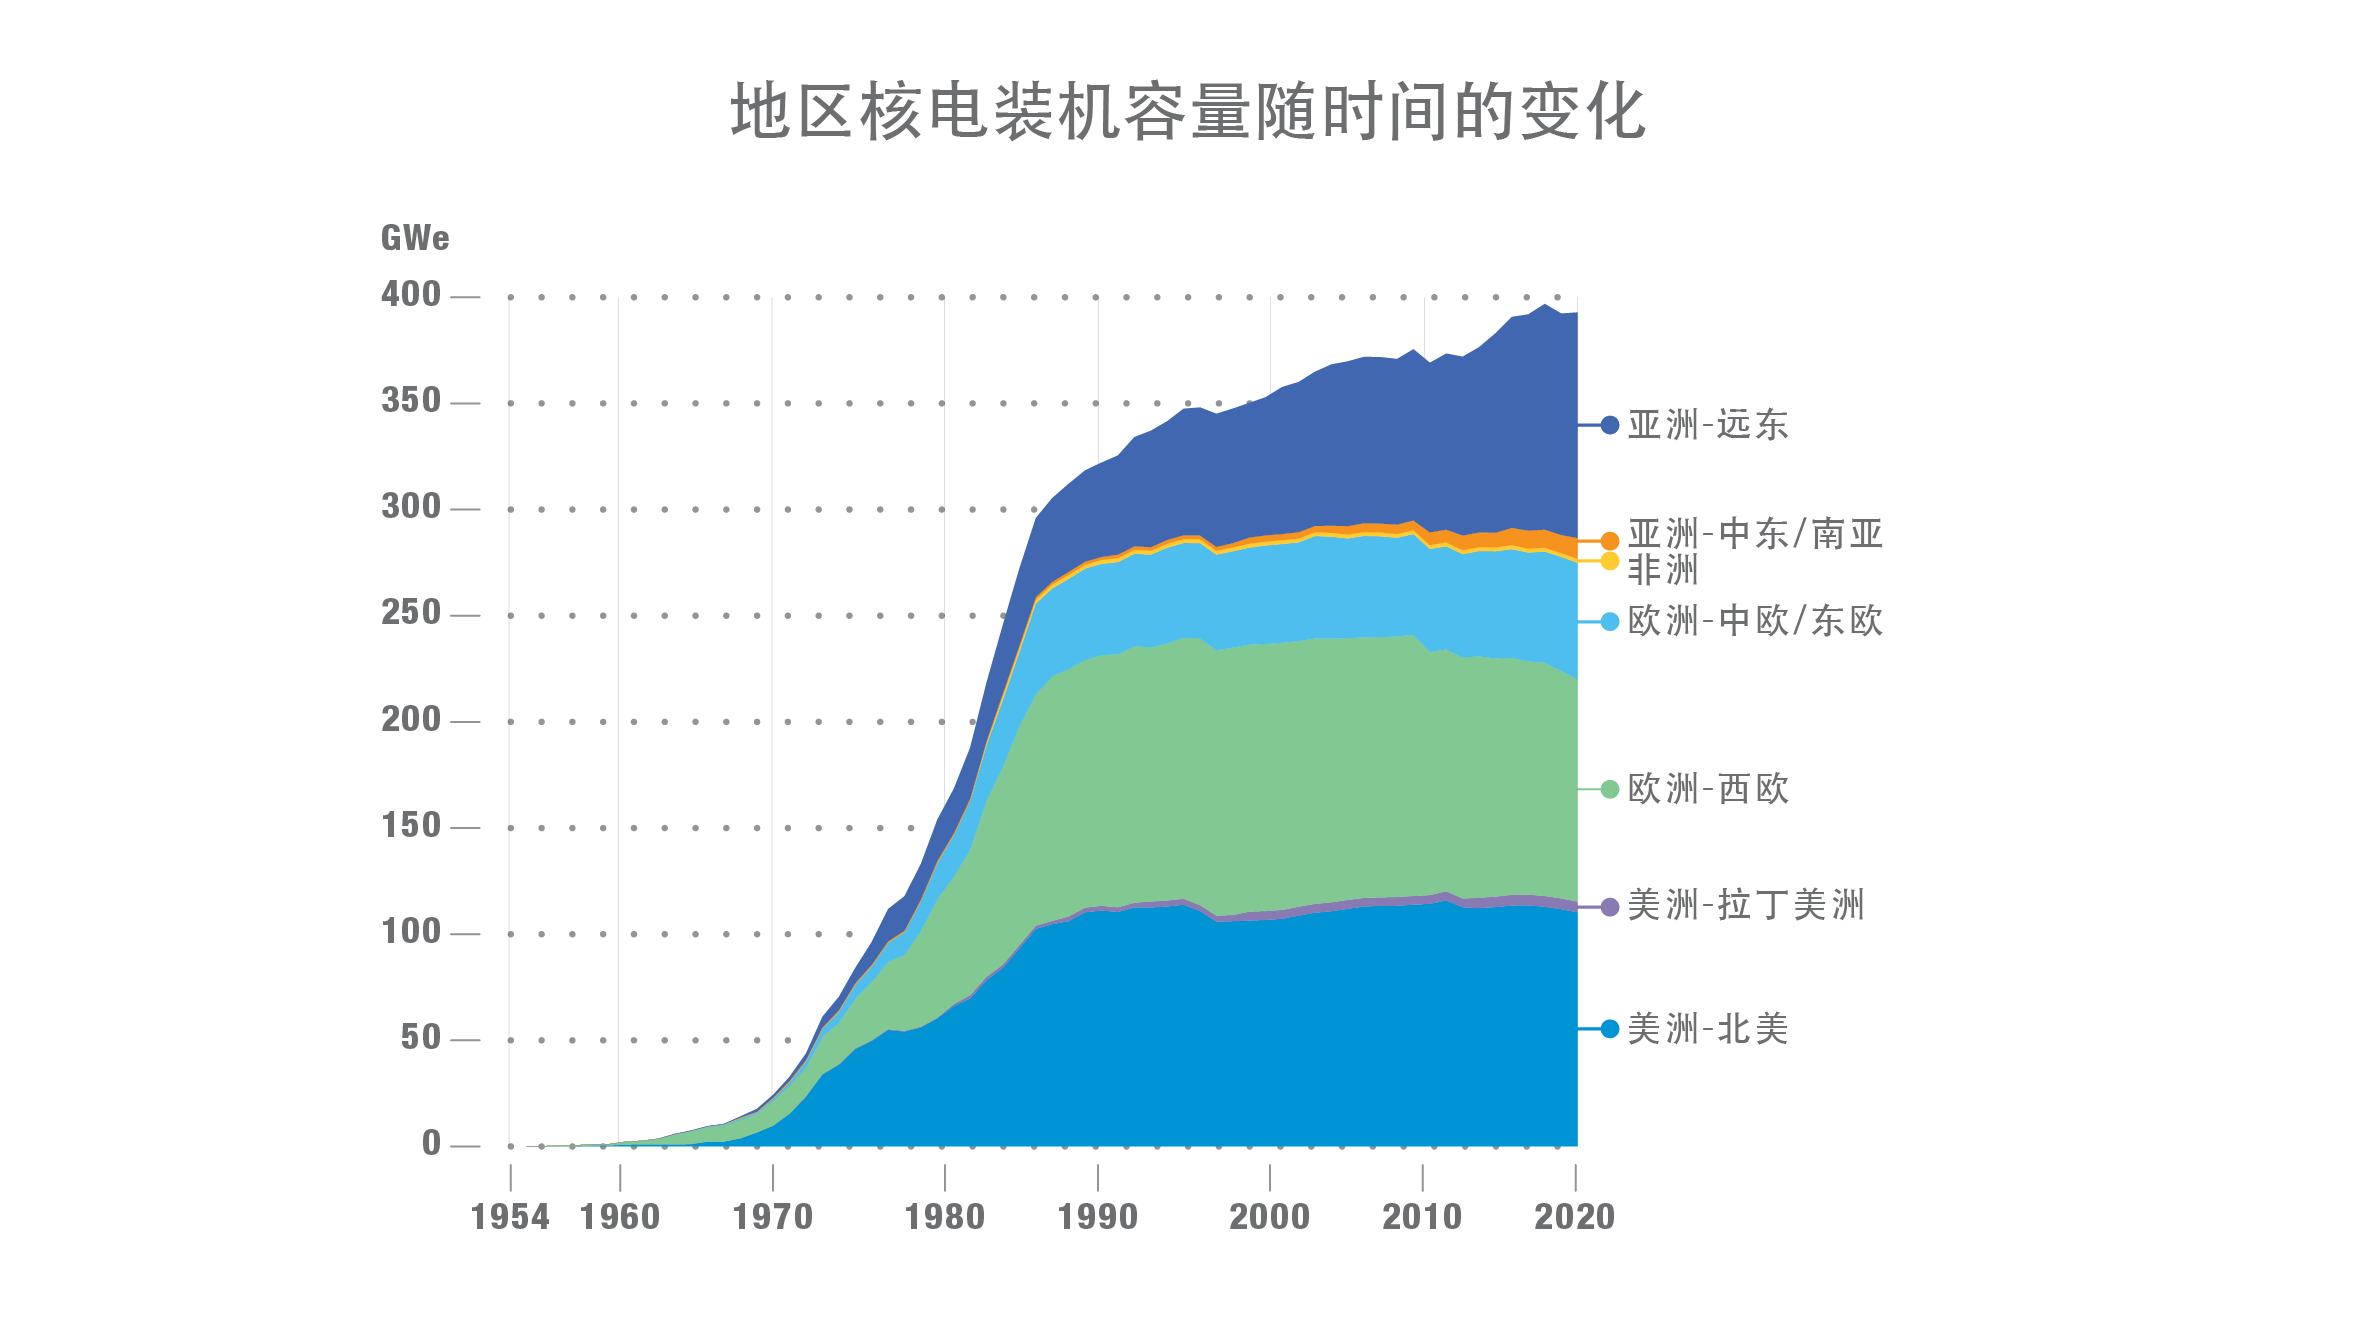
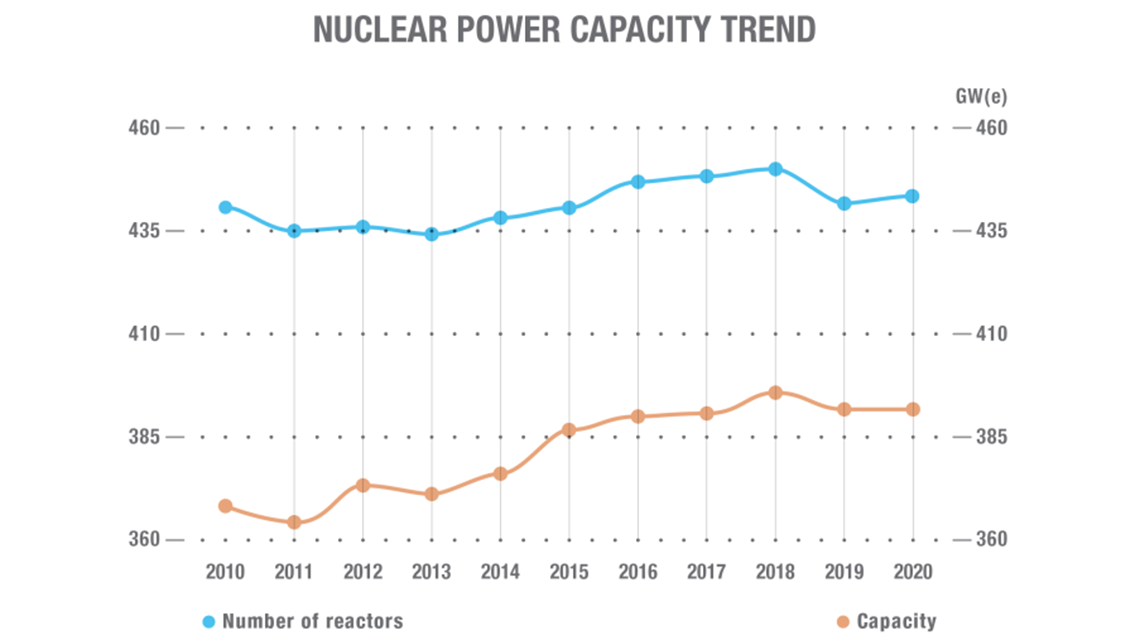
2020年12月底,全球32个国家的442座运行核动力堆的在运核电装机容量为392.6吉瓦(电)。总体而言,自2011年以来,核电装机容量逐渐增加,包括通过新机组并网和现有反应堆升级增加的约23.7吉瓦(电)容量。
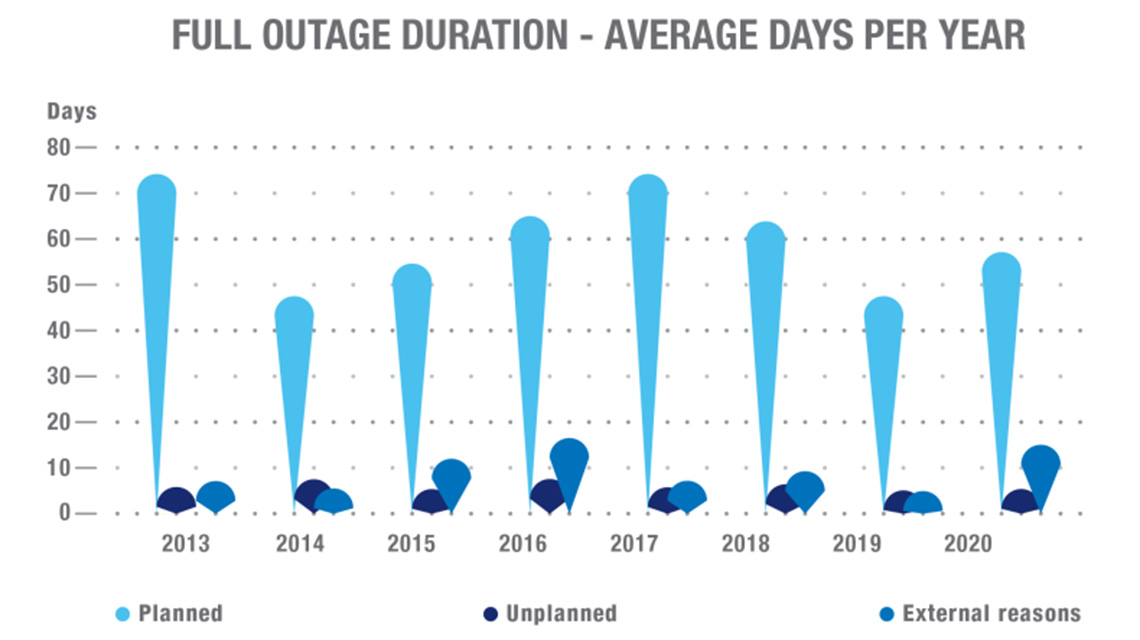
本年度期间,营运者注重于核电厂的持续运行、工作人员的保护和采用创新方案开展业务。2020年动力堆信息系统运行经验数据表明,大流行病并未导致直接停堆,也没有对核电运行产生任何直接的影响。然而,由于供应链中断、旅行限制或对允许进厂的外部工作人员的限制,大流行病影响了已计划的换料停堆和维护时间表。

2020年,由于外部原因(如电力需求大幅减少)导致的非计划停堆平均天数增加到15天,而2019年为5天。核电厂灵活运行 — 或在某些情况下短期完全停堆 — 支持了电网营运者的需求,并展现了核电融入未来可持续能源系统的能力,这些系统预期将在很大程度上依赖灵活的基荷发电技术。

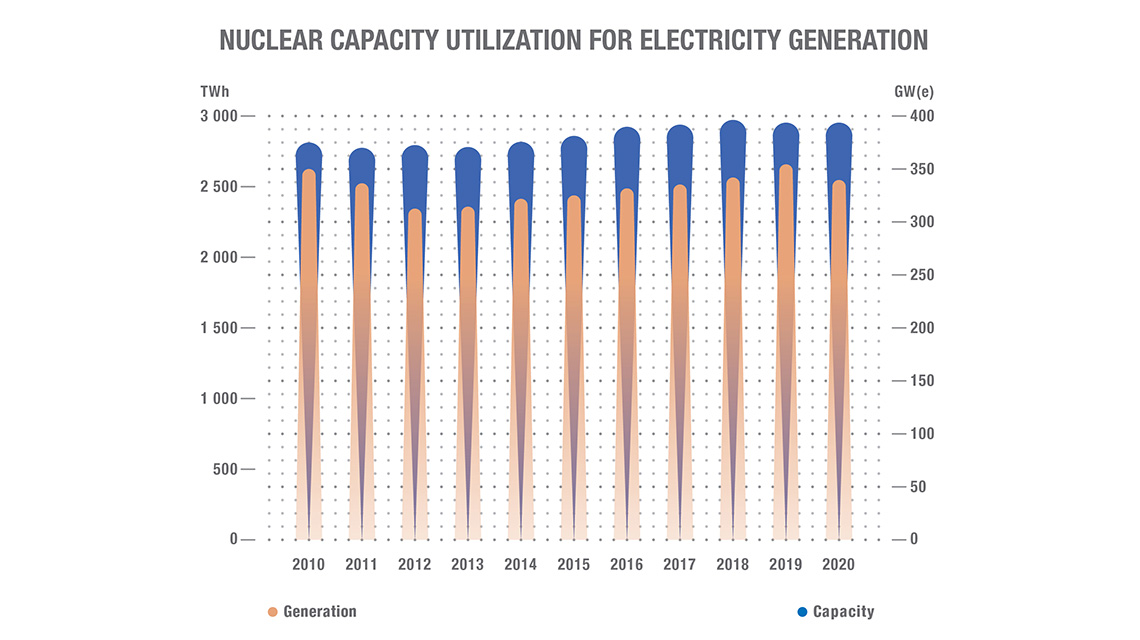
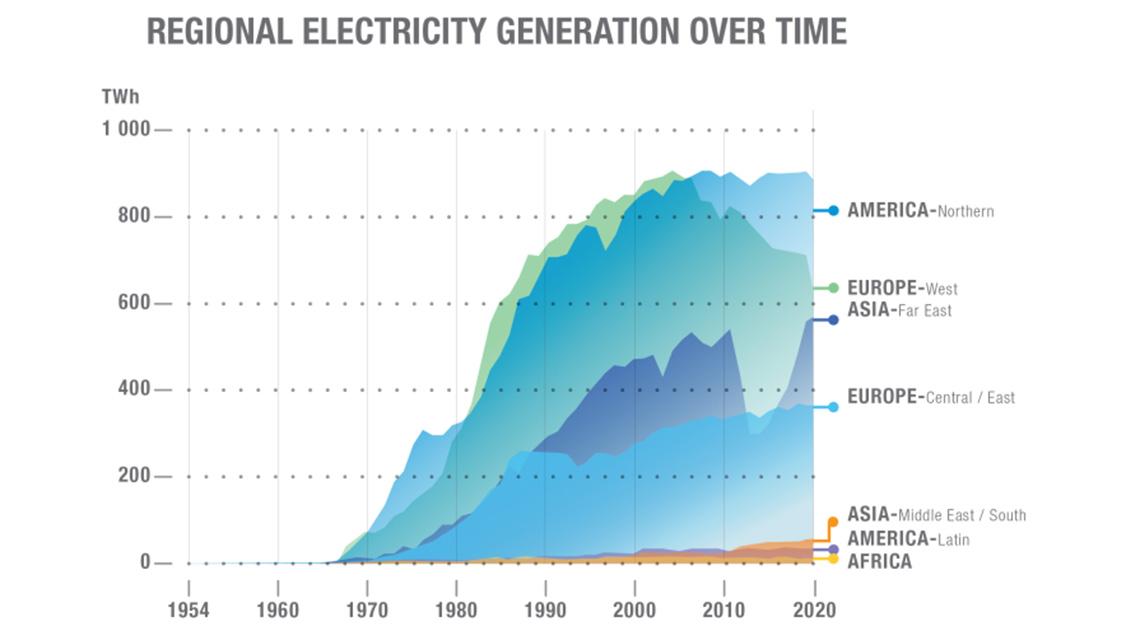
2020年全年,核动力堆提供了2553.2 太瓦时的低排放和可调度的电力,约占全球总发电量的10%和全球低碳发电量的近三分之一。2019年全球核反应堆生产了2657.1太瓦时,2020年的核电生产量与2019年相比略有降低。非洲因电力需求减少出现了核发电量下降,而在北美和西欧,则是因为需求减少和容量退役。然而,过去几年核电生产的历史趋势呈现持续增长,自2012年以来增长超过8%。

与2019年相比,2020年全球在运总装机容量略微增加了0.5吉瓦(电),但反应堆数量比2019年减少了一座。近期和长期的容量增长前景集中在亚洲,截至2020年底,亚洲报告了核电装机容量约为34.6吉瓦(电)的34座反应堆在建。
新增容量和并网机组。2020年,五座新压水堆并入电网,新核电装机容量为5.5吉瓦(电)。2019年,亚洲主导了新核电装机容量市场,占该年度所有新增装机容量的77%以上,并在2020年期间,亚洲交付了36%的新增容量,其中中国福清5号机组(1000兆瓦(电))和田湾5号机组(1000兆瓦(电))2吉瓦(电)并入电网。2020年,超过44%的新容量(相当于超过2.4吉瓦(电))系由两个先前没有任何核电运行经验的国家增加 — 白俄罗斯的白俄罗斯1号机组(1100兆瓦(电))和阿拉伯联合酋长国的巴拉卡1号机组(1345兆瓦(电))。俄罗斯列宁格勒二期2号机组于2020年10月并入电网,总容量为1066兆瓦(电),取代了在运行45年后于2020年11月永久关闭的列宁格勒2号机组(925兆瓦(电))。

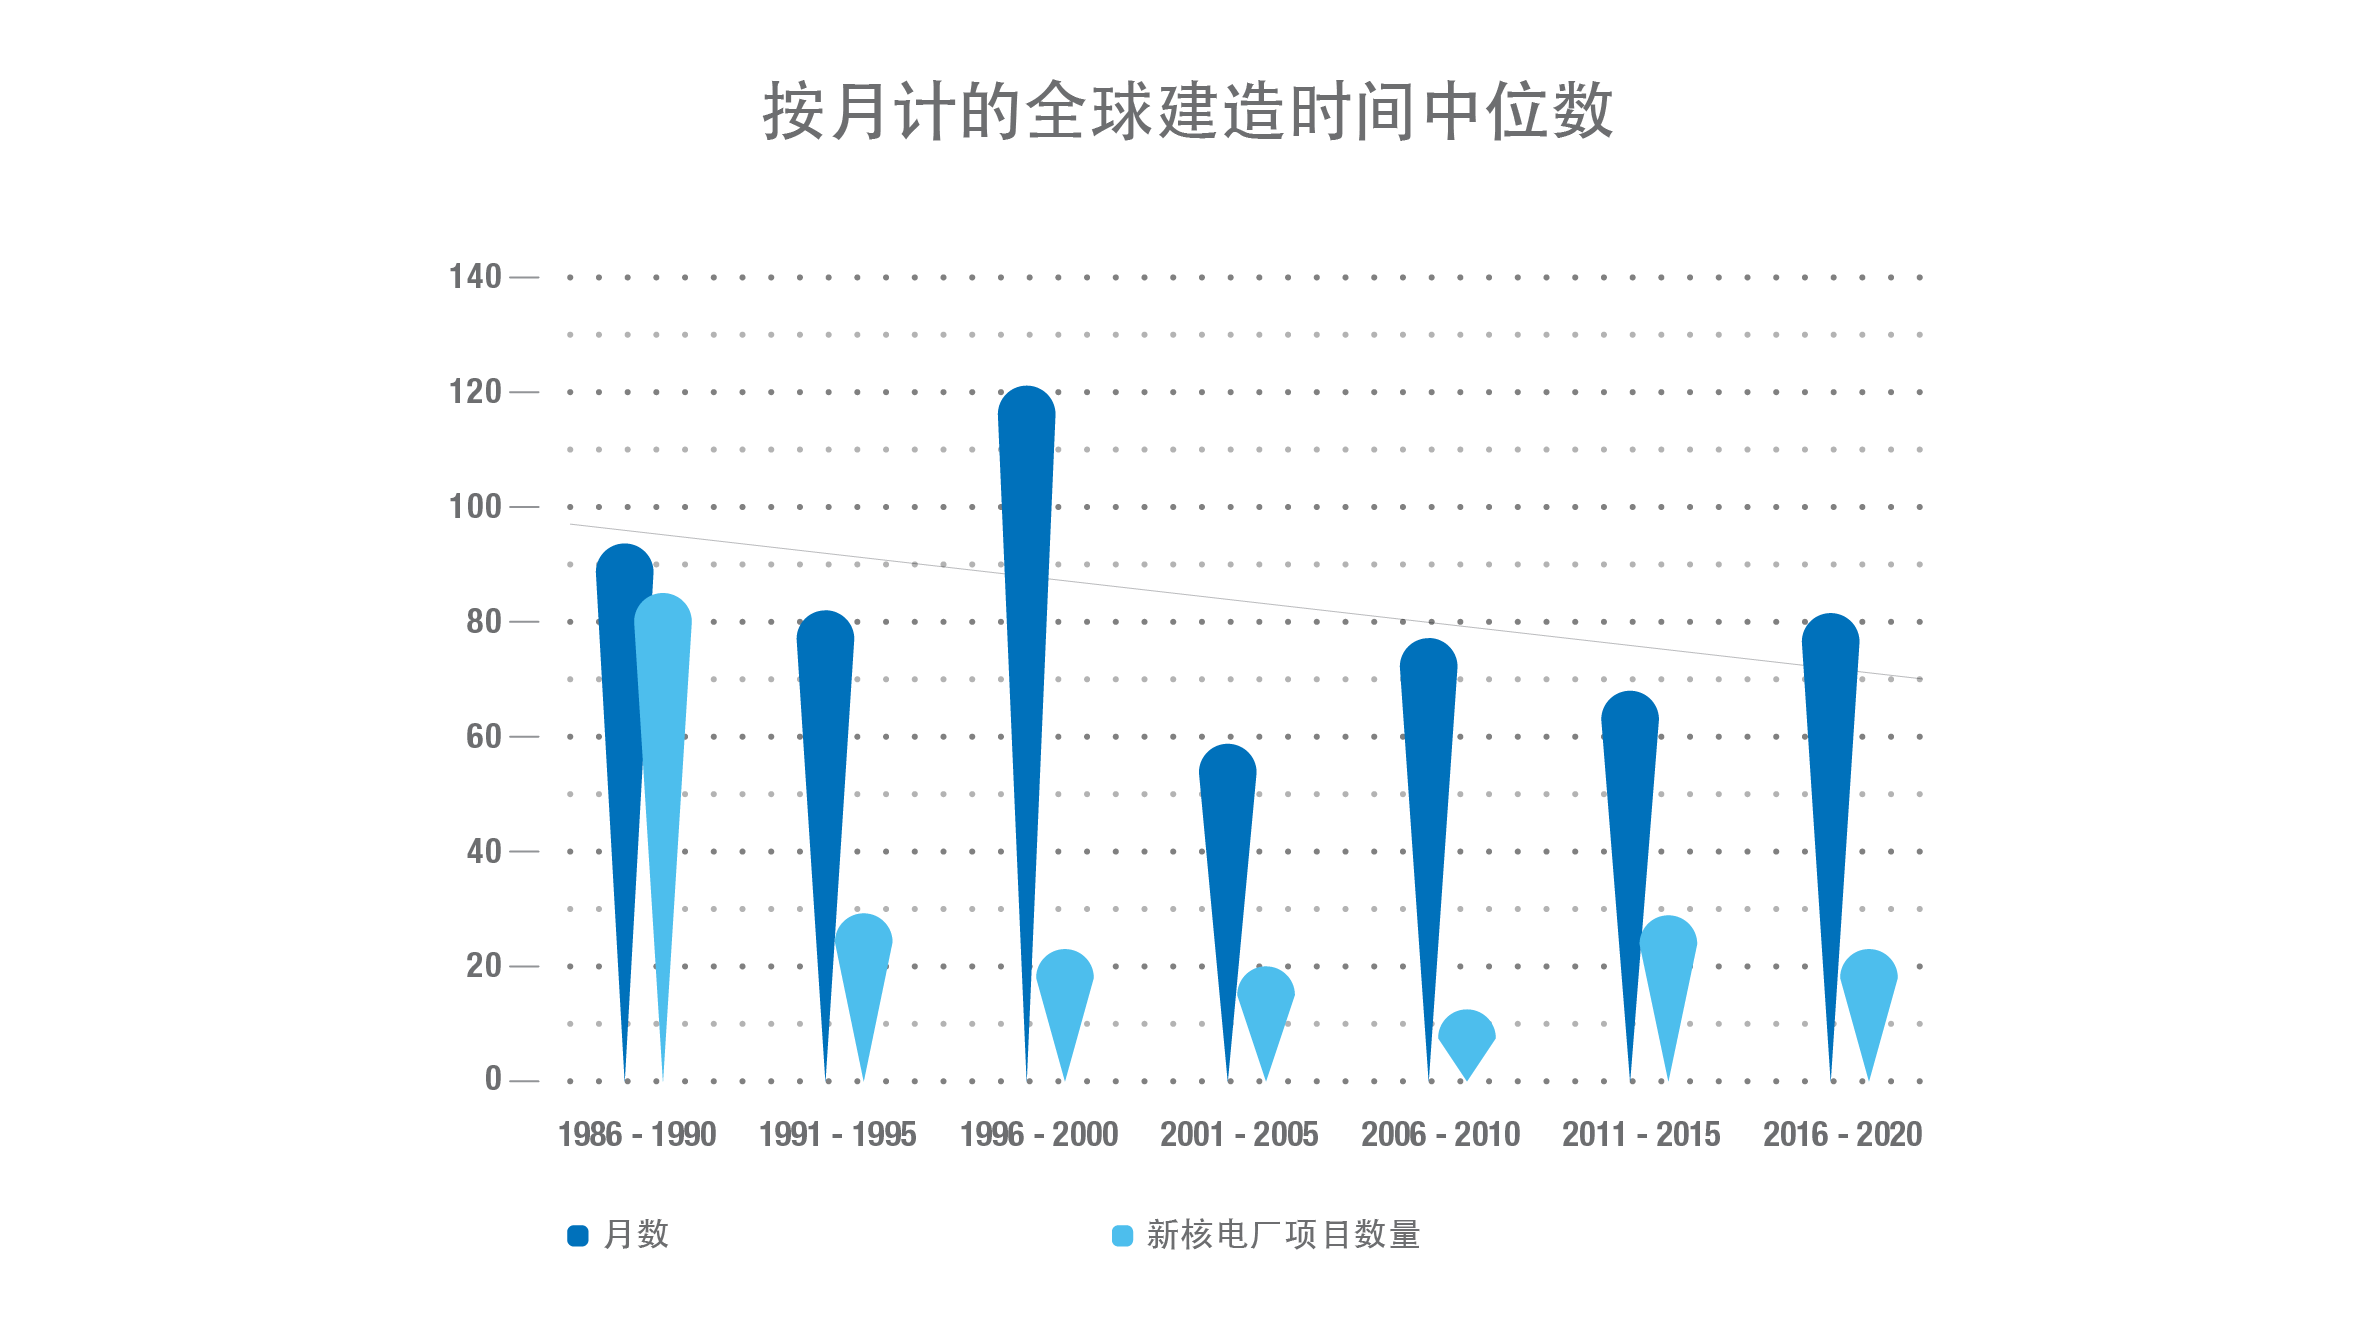
新电厂建造。近年来,新建造趋势保持稳定,与前三年相比,2020年的增长放缓。截至2020年底,19个国家正在建造52座容量超过54.4吉瓦(电)的反应堆,其中有两个国家正在建造其首座核动力堆。亚洲仍然是新反应堆建造的主要地区,自2005年以来,总共有64座反应堆并入电网,运行容量58.5吉瓦(电)。2020年,四座压水堆开始建造,其中三座反应堆在中国(三澳村1号机组(1117兆瓦(电)、太平岭2号机组(1116兆瓦(电)和漳州2号机组(1126兆瓦(电)),另一座反应堆在土耳其(阿库尤2号机组(1114兆瓦(电)))。
退出容量和永久关闭。2020年,全球有六座反应堆(5.2吉瓦(电))被永久关闭。俄罗斯列宁格勒2号机组(925兆瓦(电))于11月关闭。美国两座反应堆 — 印第安角2号机组(998兆瓦(电))和杜安阿诺德1号机组 (601兆瓦(电))分别在4月和10月关闭,这两座反应堆均运行超过46年。法国最老的两座核反应堆费桑海姆1号机组和费桑海姆2号机组 — 均为880兆瓦(电)— 分别于去年2月和6月关闭。两座反应堆都运行了42年以上。瑞典灵哈尔斯1号机组(881兆瓦(电))在服役超过46年后于2020年的最后一天关闭。
运行反应堆类型。截至2020年底,运行核电装机容量中,约89.5%是轻水慢化冷却堆、6%是重水慢化冷却堆、2%是轻水冷却石墨慢化堆,还有2%是气冷堆。剩余0.5%是总容量为1.4吉瓦(电)的三座液态金属冷却快堆。
非电力应用。2020年,10个国家的64座核动力堆提供3396.4吉瓦时电当量热支持核能的非电力应用。这种非电力应用92%以上是在欧洲利用的,56座反应堆生产了1999.4吉瓦时电当量热用于支持区域供热以及1231.7吉瓦时电当量热用于工艺供热。其余8%是在亚洲利用的,八座反应堆生产了34.7吉瓦时电当量热用于支持海水淡化以及130.6吉瓦时电当量热用于支持工艺供热。
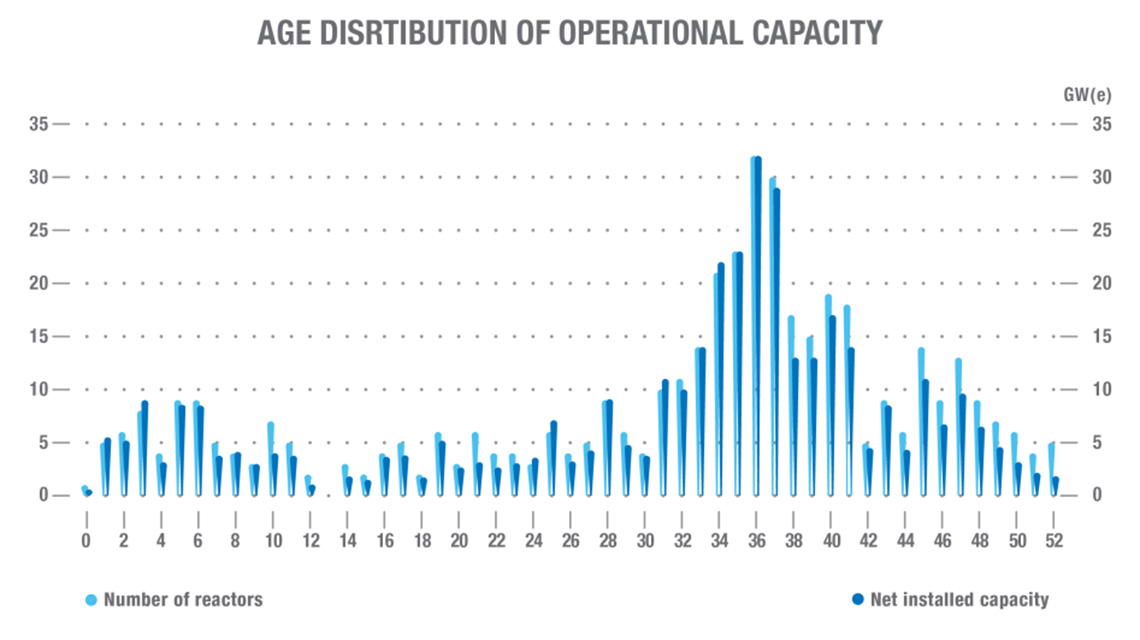
运行寿期。截至2020年底,全球634座反应堆逾66年的累计运行经验超过18 772堆年,这些反应堆分布在35个国家,总容量为479.9吉瓦(电)。其中,容量为87.2吉瓦(电)的192座反应堆已经被永久关闭。
运行反应堆总装机容量中,超过67%(256.3吉瓦(电),296座反应堆)已运行30年以上。20%的全球运行核电装机容量(104座反应堆)已服役40年以上,而有1%已运行超过50年。核电厂的老化突显出需要新增或升级核电容量来补偿已计划的退役。电力公司、政府和其他利益相关方正投资于全球越来越多的核动力堆的长期运行和老化管理计划,以确保可持续运行并向新装机容量顺利过渡。

机组实绩。即使随着核动力堆的老化,在运核电厂继续表现出高水平的总体可靠性和实绩。负荷因子也称为容量因子,是反应堆机组的实际能量产出除以全年以额定输出功率(参考单位功率)运行时产生的能量产出。高负荷因子或高容量因子表示运行实绩良好。2020年全球容量因子中位数为84.6%,与近年来的负荷因子一致。
衡量核反应堆实绩的另一个指标是能量可利用因子,它是指在特定时间段内,可利用容量能够产生的能量与参考单位功率能够产生的能量之比。2020年,加权平均能量可利用因子为76%,其中有半数核反应堆以超过87%的能量可利用因子运行。

核动力堆的可靠性和安全性持续提高。上图表明,自2003年以来,每台机组每运行7000小时(约一年),非计划手动紧急停堆(UM7)和自动紧急停堆(UA7)的次数逐渐减少。非计划紧急停堆次数的减少归因于长期以来持续改进电厂运行和维护管理。
根据原子能机构最新的核电容量预测,核电将继续在世界低碳能源结构中发挥关键作用,在高增长情景下,预计到2050年全球核发电容量将翻倍。世界核电行业已证明核电不仅在大流行病期间可以非常灵活,而且它还继续在可持续减缓气候变化方面发挥至关重要的作用。
欲获取更多核电统计数据和相关图表,请参见原子能机构动力堆信息系统数据库。自1969年以来,原子能机构基于世界各国官方指定的对口方提供的信息开发和维护动力堆信息系统。
动力堆信息系统数据也被用作原子能机构三本年度出版物的依据:
- 《成员国核电站运行经验》载有各核电站寿期内历史实绩概要和数据。
- 《世界核动力堆》(《参考数据丛书》第2号)提供原子能机构现有最新反应堆数据,除了实绩和技术规格数据外,还汇总截至2019年底在运、在建和已关闭动力堆的信息。
- 动力堆信息系统核电状况信息图表海报直观地展示世界核电状况。该出版物概述状况变化、地区统计数据、运行经验、国家统计数据等重要事实。
__________
- 核电运行统计数据不包括法国反应堆机组的停堆数据,因为这些机组的信息在出版时尚未获得。
- 本出版物中包括原子能机构截至2021年6月1日收到的信息和数据。此后收到的任何修改均可在动力堆信息系统数据库中查阅。

Restrictions on economic and social activity during the COVID-19 outbreak in 2020 led to an unprecedented and sustained decline in demand for electricity in many countries, at 10% or more, compared to 2019 levels. This created challenges for both electricity generators and system operators. Low-carbon electricity prevailed with the increasing contribution of renewable electricity, and nuclear power generation proved to be resilient, reliable and adaptable. The flexibility of nuclear power demonstrated how it can support the clean energy transition.
Cedric Lewandowski, Vice President and Group Senior Executive of EDF’s Nuclear and Thermal Division, noted that electricity consumption fell about 15% in France during the lockdowns, and most of the demand was met by nuclear, hydro and other renewables. The flexibility of the nuclear fleet was used extensively, with the number of load variations up by 50% compared to the same period in 2019.
At the end of December 2020, the global operating nuclear power capacity was 392.6 GW(e) from 442 operational nuclear power reactors in 32 countries. Overall, nuclear power capacity since 2011 has gradually increased, including some 23.7 GW(e) of capacity added by the connection of new units to the grid and upgrades to existing reactors.
During the year, operators focused on the continued operation of the nuclear power plants, protection of staff and implementation of innovative approaches to conduct their businesses. The pandemic forced no direct shutdowns, nor did it have any direct impact on nuclear power operation, according to the 2020 PRIS operating experience data. However, the pandemic impacted schedules of planned outages for refuelling and maintenance due to disruptions in supply chain, travel restrictions or limitations on external staff permitted on site.
Unplanned outages due to external reasons, such as significant decreases in electricity demand, increased to 15 average days in 2020, in comparison to 5 days in 2019. Flexible NPP operation — or, in some cases, complete short-term shutdowns — supported grid operator needs and demonstrated nuclear power’s ability to integrate into sustainable energy systems of the future, which are expected to rely significantly on flexible baseload generation technologies.
Throughout 2020, nuclear power reactors supplied 2553.2 TWh of low-emission and dispatchable electricity, which accounted for about 10% of total global electricity generation and nearly a third of the world’s low-carbon electricity generation. The 2020 nuclear power production was slightly lower compared to 2019, when the world’s nuclear reactors produced 2657.1 TWh. Lower nuclear generation occurred in Africa due to decreased electricity demand and in North America and Western Europe due to lower demand and retired capacity. However, the historical trend of nuclear power generation demonstrates a continuous growth over the past years, with over 8% increase since 2012.
In 2020, total global operating capacity increased slightly by some 0.5 GW(e) compared with 2019, however, the number of reactors decreased by one compared to 2019. Near- and long-term capacity growth prospects are centred in Asia, which at the end of 2020, reported 34 reactors with some 34.6 GW(e) of nuclear power capacity under construction.

Capacity added and units connected to the grid. In 2020, five new pressurized water reactors (PWR) with 5.5 GW(e) of new nuclear capacity were connected to the grid. Asia dominated the new nuclear capacity market in 2019, hosting over 77% of all new capacity additions that year, and during 2020, Asia delivered 36% of new capacity additions with 2 GW(e) connected to the grid in China at Fuqing-5 (1000 MW(e)) and Tianwan-5 (1000 MW(e)). In 2020, more than 44% of new capacity equating to over 2.4 GW(e) was added by two countries with no previous nuclear power operating experience – Belarusian 1 (1110 MW(e)) in Belarus and Barakah-1 (1345 MW(e)) in the United Arab Emirates. In Russia, Leningrad 2-2 was connected to the grid in October 2020 with a total capacity of 1066 MW(e), replacing Leningrad-2 (925 MW(e)), which was permanently shut down in November 2020 after 45 years of operation.

New build construction. The new construction trend has remained steady in recent years, with slower growth in 2020, compared to the previous three years. At the end of 2020, 52 reactors with over 54.4 GW(e) of capacity were under construction in 19 countries, including in two countries building their first nuclear power reactors. Asia continues to be the dominant region in new reactor construction, where a total of 64 reactors with 58.5 GW(e) operational capacity have been connected to the grid since 2005. In 2020, the construction of four PWR reactors began, with three reactors in China (Sanaocun-1 (1117 MW(e)), Taipingling-2 (1116 MW(e)) and Zhangzhou-2 (1126 MW(e)) and one reactor in Turkey (Akkuyu-2 (1114 MW(e)).
Capacity removed and permanent shutdowns. In 2020, six reactors (5.2 GW(e)) were permanently shut down globally. Leningrad-2 (925 MW(e)) in Russia shut down in November. Two reactors shut down in the United States – Indian Point-2 (998 MW(e)) and Duane Arnold-1 (601 MW(e)) in April and October, respectively, after more than 46 years of operation each. France’s two oldest nuclear reactors, Fessenheim 1 and Fessenheim 2 — each 880 MW(e) — shut down last year in February and June, respectively. Both operated for more than 42 years. Ringhals-1 (881 MW(e)) in Sweden shut down on the last day of 2020, after more than 46 years of service.
Operational reactor types. As of the end of 2020, some 89.5% of the operational nuclear power capacity was comprised of light water moderated and cooled reactor types; 6% were heavy water moderated and cooled reactor types; 2% were light water cooled and graphite moderated reactor types, while 2% were gas cooled reactor types. The remaining 0.5% were three liquid metal cooled fast reactors with a total capacity of 1.4 GW(e).
Non-electric applications. In 2020, 64 nuclear power reactors in 10 countries applied 3396.4 GWh of electrical equivalent heat to support non-electric applications of nuclear energy. Over 92% of the non-electric applications were utilized in Europe, generating 1999.4 GWh of electrical equivalent of heat to support district heating and 1231.7 GWh for process heating by 56 reactors. The remaining 8% was utilized by 8 reactors in Asia to generate 34.7 GWh of electrical equivalent of heat to support water desalination and 130.6 GWh to support process heating.

Operational lifetime. At the end of the 2020, the worldwide cumulative operating experience over 66 years amounted to over 18,772 reactor years, from 634 reactors with a total capacity of 479.9 GW(e) across 35 countries. Of this, 192 reactors with 87.2 GW(e) have been permanently shut down.
Over 67% of total operational reactor capacity (256.3 GW(e), 296 reactors) have been in operation for over 30 years. Twenty percent of global operating nuclear capacity (104 reactors) have been in service for over 40 years, while 1% has been operating for over 50 years. The aging nuclear fleet highlights the need for new or upgraded nuclear capacity to offset planned retirements. Utilities, governments and other stakeholders are investing in long term operation and ageing management programmes for an increasing number of nuclear power reactors globally to ensure sustainable operation and a smooth transition to new capacity.
Unit performance. Even as the nuclear power fleet ages, operational NPPs continue to demonstrate high levels of overall reliability and performance. The load factor, also referred to as the capacity factor, is the actual energy output of a reactor unit divided by the energy output that would be produced if it operated at its rated power output (reference unit power) for the entire year. A high load or capacity factor indicates good operational performance. In 2020, the global median capacity factor was 84.6%, in line with the load factor in recent years.
Another indicator measuring the performance of nuclear reactors is the energy availability factor (EAF), which refers to the ratio of energy that the available capacity could have produced during a specific time period, compared to the energy that the reference unit power (RUP) could have produced. In 2020, the weighted average EAF was 76%, where half of nuclear reactors also operated with an EAF above 87%.

The reliability and safety of nuclear power reactors continues to improve. The graph above demonstrates a gradual reduction of unplanned manual (UM7) and automatic scrams (UA7) per 7000 hours (approximately one year) of operation per unit since 2003. The reduction in the number of unplanned scrams is attributed to a history of continuously improving plant operations and maintenance management.
Based on the latest IAEA nuclear capacity projections, nuclear power will continue to play a key role in the world’s low-carbon energy mix, with global nuclear electrical capacity projected to double by 2050 in the high case scenario. The world’s nuclear power industry has not only proven that it can be flexible during a pandemic, but it also continues to serve a vital role in sustainable climate change mitigation.
For more nuclear power statistical data and related graphics, refer to the Agency’s PRIS database. PRIS has been developed and maintained by the IAEA since 1969, based on information from officially nominated counterparts in countries worldwide.
PRIS data are also used as the basis for three annual IAEA publications:
- Operating Experience with Nuclear Power Stations in Member States (OPEX) contains a historical summary of performance during the lifetime of individual plants and figures.
- Nuclear Power Reactors in the World, Reference Data Series No. 2 (RDS-2) presents the most recent reactor data available to the IAEA, summarizing information as of the end of 2019 on power reactors operating, under construction and shut down in addition to performance and specification data.
- The PRIS Nuclear Power Status infographics poster visually presents the status of nuclear power in the world. It summarizes status changes, regional statistics, operating experience, country statistics, among other key facts.
__________
- Nuclear power operating statistics do not include outage data from French reactor units as information for these units was not available by the time of publication.
- Information and data received by the IAEA through 1 June 2021 are included in this publication. Any modifications received at a later date are available in the PRIS database.

相关资源
更多
COVID-19
Power Reactor Information System (PRIS)
Nuclear power and climate change: Decarbonization
Nuclear power and climate change: Decarbonization
Climate change
Non-electric applications
Nuclear power reactors
Energy planning
Energy
Nuclear Power Engineering Section
Division of Nuclear Power
Department of Nuclear Energy